China Stimulus
-Much has been said (and written about) the extraordinary events of last week involving the unveiling of China’s stimulus measures, aimed primarily at protecting the central governments 5% growth edict.
-Announced 3 trading days subsequent to the US Federal reserve’s 0.50% rate cut, the measures achieved the desired ‘shock and awe’ response from financial markets.
-Interesting, the same week we heard that US ownership of Chinese equities had plumbed 5 year lows and that India’s weighting in key EM ETF’s now eclipsed that of China’s.
-The various measures were noteworthy for several reasons, not the least of which being the first steps towards Beijing putting some form of floor under consumer and business confidence.
-We thought it was particularly significant that 1) the central government finally unbent, 2) they employed DIRECT intervention via a variety of measures, 3) it was coordinated through several government agencies (including the PBoC, MOF and Politburo) and 4) this was likely the opening salvo.
-The Chinese stock market staged a powerful rally in response, with the closely monitored (by the National People’s congress) Shanghai Composite Index + 4.5% on the day of the first announcements.
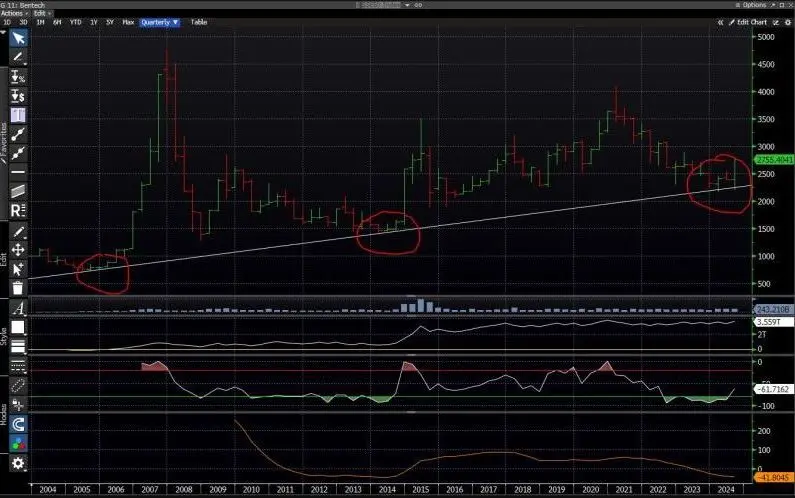
-For me it was the technically significant response from the Shanghai SSE 50 (SSE50) that caught my attention. A support line originating in mid 2005 has been underwriting the SSE50, hosting multiple touchpoints (circled) since this time. Buyers overcame sellers convincingly in 2005, 2006, 2014, March 2024 and again in past days. Market sages know to put great weight in long term charts like these and this important watershed should not be overlooked by investors.